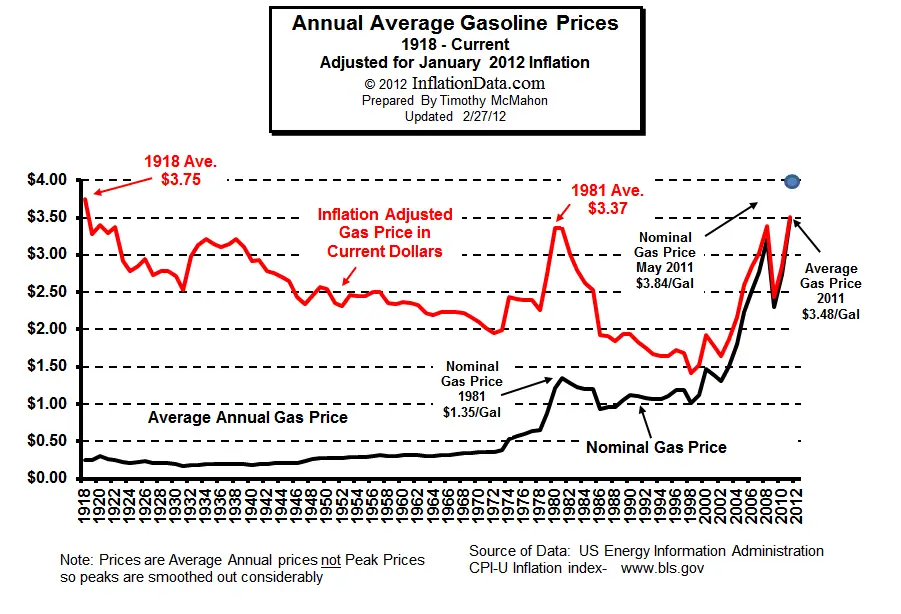
Today I will examine a major contributor to the subprime mortgage crisis. It has nothing to do directly with mortgages unless you consider the ability to pay your mortgage important. I'm sure you've heard the saying a picture is worth a 1000 words. Look at this chart of the historical cost of gasoline courtesy of Inflationdata.com. It is worth 10 fold a picture. Notice that the annual average cost of gasoline in 2002 when many of these subprime adjustable rate mortgages were written was less than $1.50 a gallon!! By 2006 when these subprime mortgages had to be renewed the price was $2.50 a gallon, an increase of 66%. In 2007 the price increased to $2.75, that's 10% in 1 year!! Even if mortgage prices remained stable or even decreased 2%-5% these increases in gasoline would challenge most people's budgets.
Another interesting fact is gas prices ranged between $1.00 and $1.25 throughout the '90s. During this same period SUVs, few of which got better than 15 mpg, were selling like hotcakes. The Lincoln Navigator, one of the biggest pieces of automotive metal available to consumers, gets 12 mpg city 18 mpg highway. This behomoth was developed during the 90s and first produced in 1998. Does the price of gasoline affect car buying decisions? you bet it does!!
P. S. I definitely recommend you visit inflationdata.com. It has charts on historical costs of many items such as oil and gasoline. It is an eyeopening experience to behold. It also has tutorials on subjects to give us a perspective on inflation and money. If you don't want to live a hand to mouth existence until the day you die, this website will help you avoid this.


No comments:
Post a Comment